
On-Chain DCA Strategy
Active DCA Strategy


Strategy | Initial Investment | Final Value (Dec 2025) | ROI |
|---|---|---|---|
Buy & Hold (Lump Sum) | $10,000 | $58,740 | +487% |
Active DCA (STH-MVRV) | $10,000 | $196,655 | +1,866% |
The chart above visualizes the performance of your Active DCA Strategy vs. Buy & Hold (Lump Sum) starting from the market top in Jan 2018 (a realistic “worst case” entry point).
Key Takeaway: By simply avoiding the “Orange Zones” (Sell) and aggressively buying the “Green Zones” (Buy), the Active Strategy transforms a difficult bear market into a massive opportunity.
The Strategy
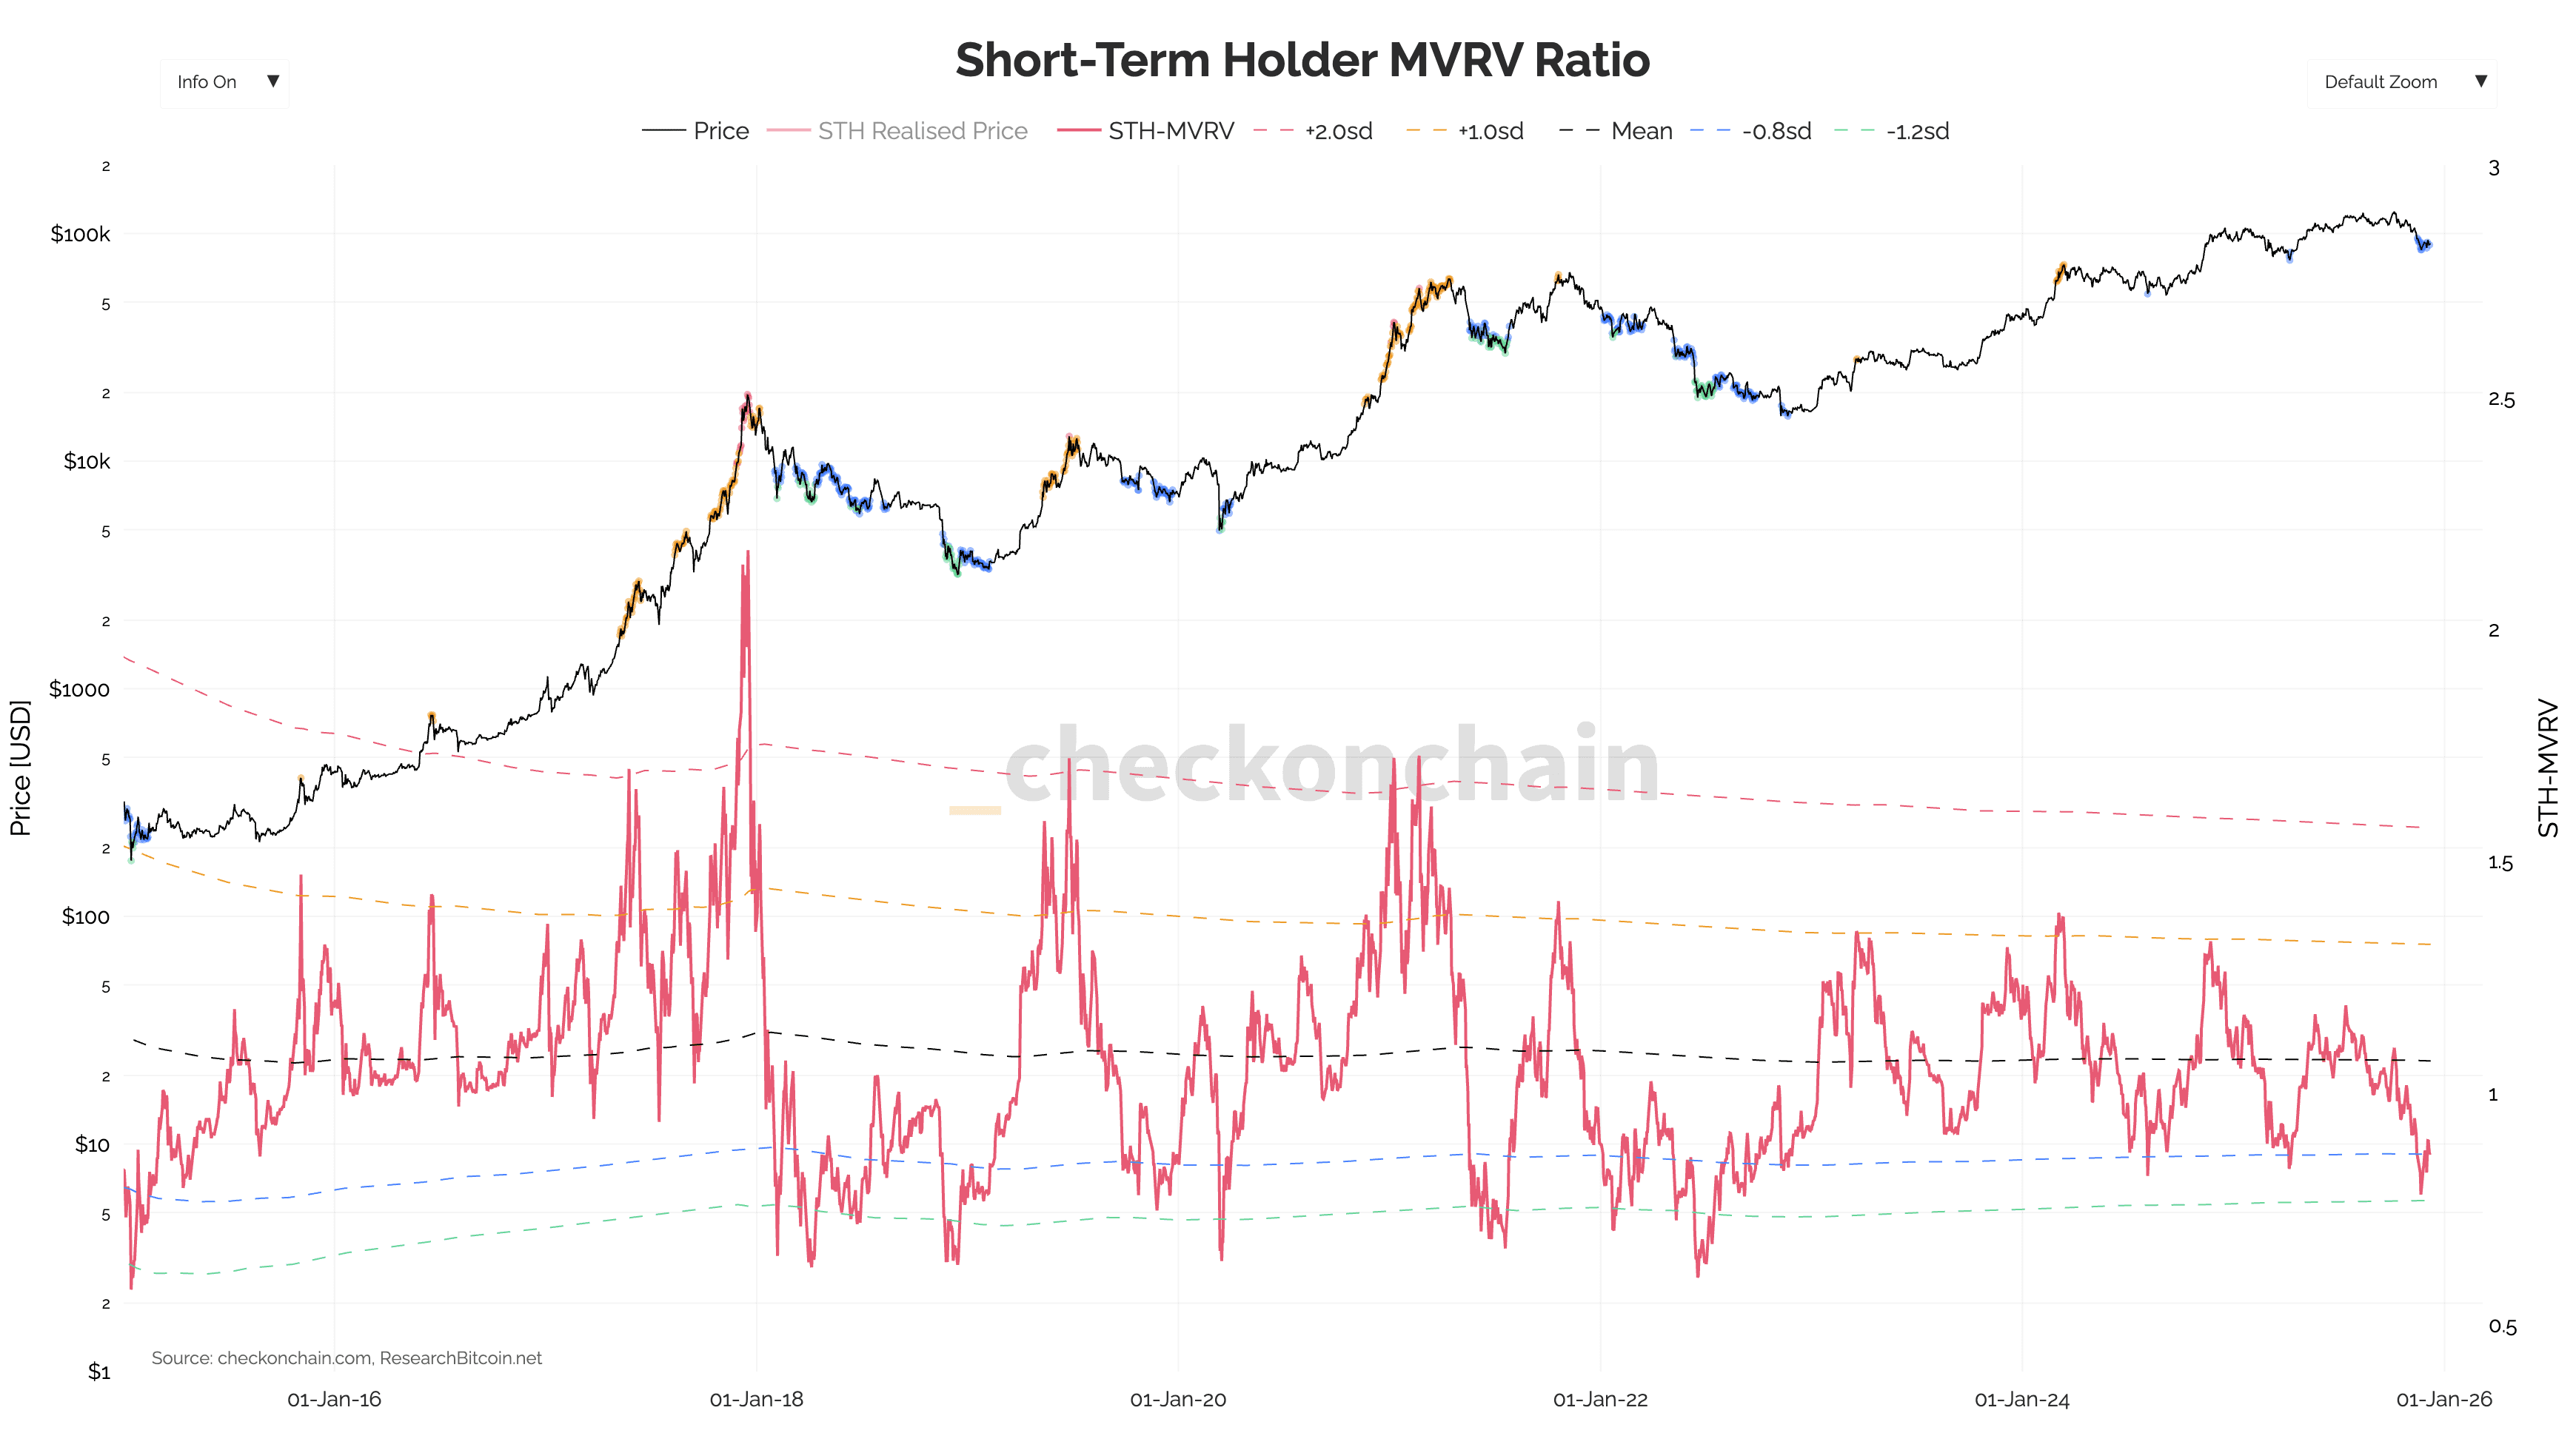
The Core Logic
We are looking at a metric called STH-MVRV. You don’t need to know the complex math behind it, but you do need to know what it measures: New Investor Profitability.
High Score: New investors are making a lot of money fast. This usually means “Greed” and a crash is coming.
Low Score: New investors are losing money. This usually means “Panic” and a bottom is near.
Link to indicator: https://charts.checkonchain.com/btconchain/unrealised/mvrv_sth/mvrv_sth_light.html
The 3 Rules (The Traffic Light System)
🟢 Phase 1: The Buy Zone (Go)
What you see: The Red Line on the chart drops below the Green Band.
What it means: The market is in panic mode. “Tourists” are selling at a loss. Bitcoin is “on sale.”
Your Action: You turn on a recurring Daily Buy. Example: You set up an automatic purchase of $100 every single day as long as the line is in this zone.
Goal: To accumulate as much Bitcoin as possible at cheap prices while everyone else is scared.
🔴 Phase 2: The Sell Zone (Stop)
What you see: The Red Line on the chart shoots above the Orange Band.
What it means: The market is overheated. Everyone is euphoric, and your Uber driver is giving you crypto tips.
Your Action: You turn on a recurring Daily Sell. Example: You sell 2% or 5% of your total Bitcoin holdings every day as long as the line is in this zone.
Goal: To slowly cash out your profits near the top without having to guess the exact peak.
🟡 Phase 3: The Wait Zone (Caution)
What you see: The Red Line is floating between the Green and Orange bands.
What it means: The market is uncertain or just chopping sideways.
Your Action: Do Nothing. If you have Bitcoin, just hold it. If you have Cash, keep it in the bank.
Goal: To protect your sanity. Most people lose money trying to trade during these boring times. We only act at the extremes.
FROM INSIGHT TO PROCESS
Research is useful. A process you can trust is better.
Crypto Gameplan helps self-directed investors connect research, market regime, selection, risk, and exits into a documented decision process, without living in front of your computer or giving up control.
Education and research. You make and execute every final decision.

© 2026 Crypto Gameplan. All Rights Reserved.