
Backtested on 10 years of real BTC data
BTC Regime Checklist
Three indicators. Every number comes from our backtesting pipeline: similar returns to buy-and-hold with half the drawdown.


Here are the 3 indicators
Here are the 3 indicators. Every number below comes from our backtesting pipeline. Not opinions. Data.
Metric | 3-Step System | Buy & Hold |
|---|---|---|
Return (2020-2026) | +948% | +861% |
Max Drawdown | -38.1% | -76.7% |
Sharpe Ratio | 1.17 | 0.84 |
Trades | 28 | - |
Similar returns. Half the drawdown. Buy-and-hold hit -77% in 2022. The system? -38%. That’s the difference.
You’ve watched the chart, bought too early, and sat through the drop. These three steps exist so that stops happening.
So how does it actually work?
Step | Indicator | The question | The rule |
|---|---|---|---|
Step 1 | Regime Filter | Is price above the 50-day SMA? | Yes → bull regime. No → stay flat. |
Step 2 | Trend Strength | Is the 20-day momentum score above +60? | Yes → trend confirmed. 92% it continues. |
Step 3 | Pullback Entry | Did price dip to the EMA and bounce? | Green triangle → that’s the entry. |
These confirm entries, not predict them. And they work best together. Always size your positions properly.
Step 1: Regime Filter · 1 line, 3x the return
One line on the chart. 50-day SMA. Price above it? Bull regime, you’re allowed to look for entries. Below it? Stay flat. No exceptions.
Metric | Buy & Hold | With Filter |
|---|---|---|
Return (2020-2026) | +619% | +1,541% |
Max Drawdown | -76.7% | -57.6% |
Sharpe Ratio | 0.84 | 1.31 |
One filter. Nearly triple the return. Drawdown cut by 19 points. Because you’re flat during every crash instead of riding it down.

Set it up
TradingView → Indicators → search “CGP Regime Filter”
Or add a regular 50-day SMA
Price above → Step 2. Below → do something else.
Step 2: Trend Strength · 92% continuation probability
Counts higher highs/lows vs lower highs/lows over 20 days. Score from -100 to +100. Above +60? Trend confirmed.
Window | P(continues) | Baseline | Edge |
|---|---|---|---|
5 days | 80.8% | 54.6% | +26.1% |
10 days | 86.8% | 55.5% | +31.3% |
20 days | 91.8% | 56.2% | +35.6% |
At 20 days, there’s a 92% probability it continues. Not a pattern. A statistical property of how BTC moves.
So when you see +60, the math is already on your side.

Set it up
TradingView → Indicators → search “CGP 20d Trend Strength”
Histogram crosses the +60 dotted line → confirmed
Info table shows direction, strength, and status
Step 3: Pullback Entry · buy the dip with confirmation
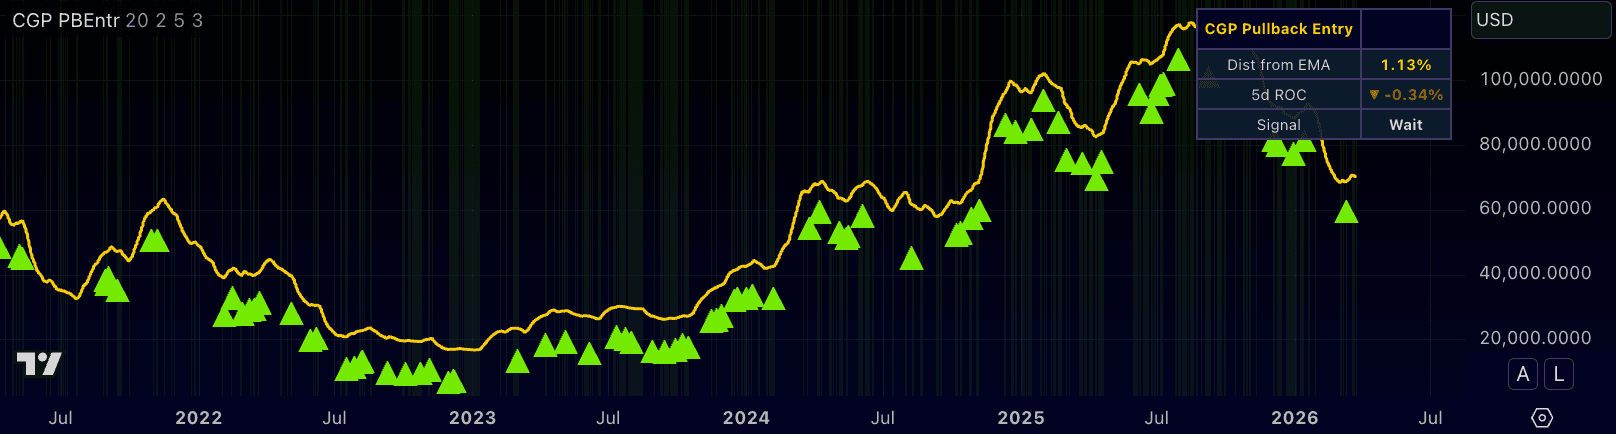
Bull regime + confirmed trend. Now wait for the right price. This indicator tracks the 20-day EMA and fires when:
Price pulled back to within 2% of the EMA
Price is now back above the EMA
5-day ROC just turned positive
All three? Green triangle below the bar. That’s the entry.
Set it up
TradingView → Indicators → search “CGP Pullback Entry”
Gold EMA line + subtle green zone when price is near it
Green triangle below a bar → enter
3-Step Entry Checklist
Now put it all together.
Step 1: Price above 50-day SMA? → Bull regime confirmed.
Step 2: Trend strength above +60? → Momentum confirmed.
Step 3: Green triangle? → Pullback bounce confirmed.
All 3? Enter. Regime, trend, and timing all agree.
1 + 2 but not 3? Right market, right time. Wait for the pullback.
Step 1 fails? Stop. Bear regime means flat.
2,157 strategies tested across 7 assets, 10 years of data, and 1,000 synthetic scenarios per strategy. 34 survived. Every single winner was momentum-based.
Follow @cryptogameplan for more data-driven crypto insights.
FROM INSIGHT TO PROCESS
Want the full system?
You've got the entry signals. But entries are half the equation. How much to risk, when to add, when to exit: that's what separates a signal from a system. CryptoGameplan is not a course and not signals. It's a community of investors building real, systematic approaches to crypto.
Education and research. You make and execute every final decision.

© 2026 Crypto Gameplan. All Rights Reserved.