
AUGUST 19 EVENT CASE FILE
The Start Of A Crypto Bullrun?
My decision-making process for the next weeks & what I am paying attention to


The one-page answer
Treasury is the best-supported trigger for the first cross-asset repricing. It doesn't explain the full crypto rally.
Forced short covering was the first mechanically identifiable buyer class. Daily ETF creations and venue-specific spot imbalance separately show that non-futures demand was present after the event, but they can't establish the order of one intraday sequence.
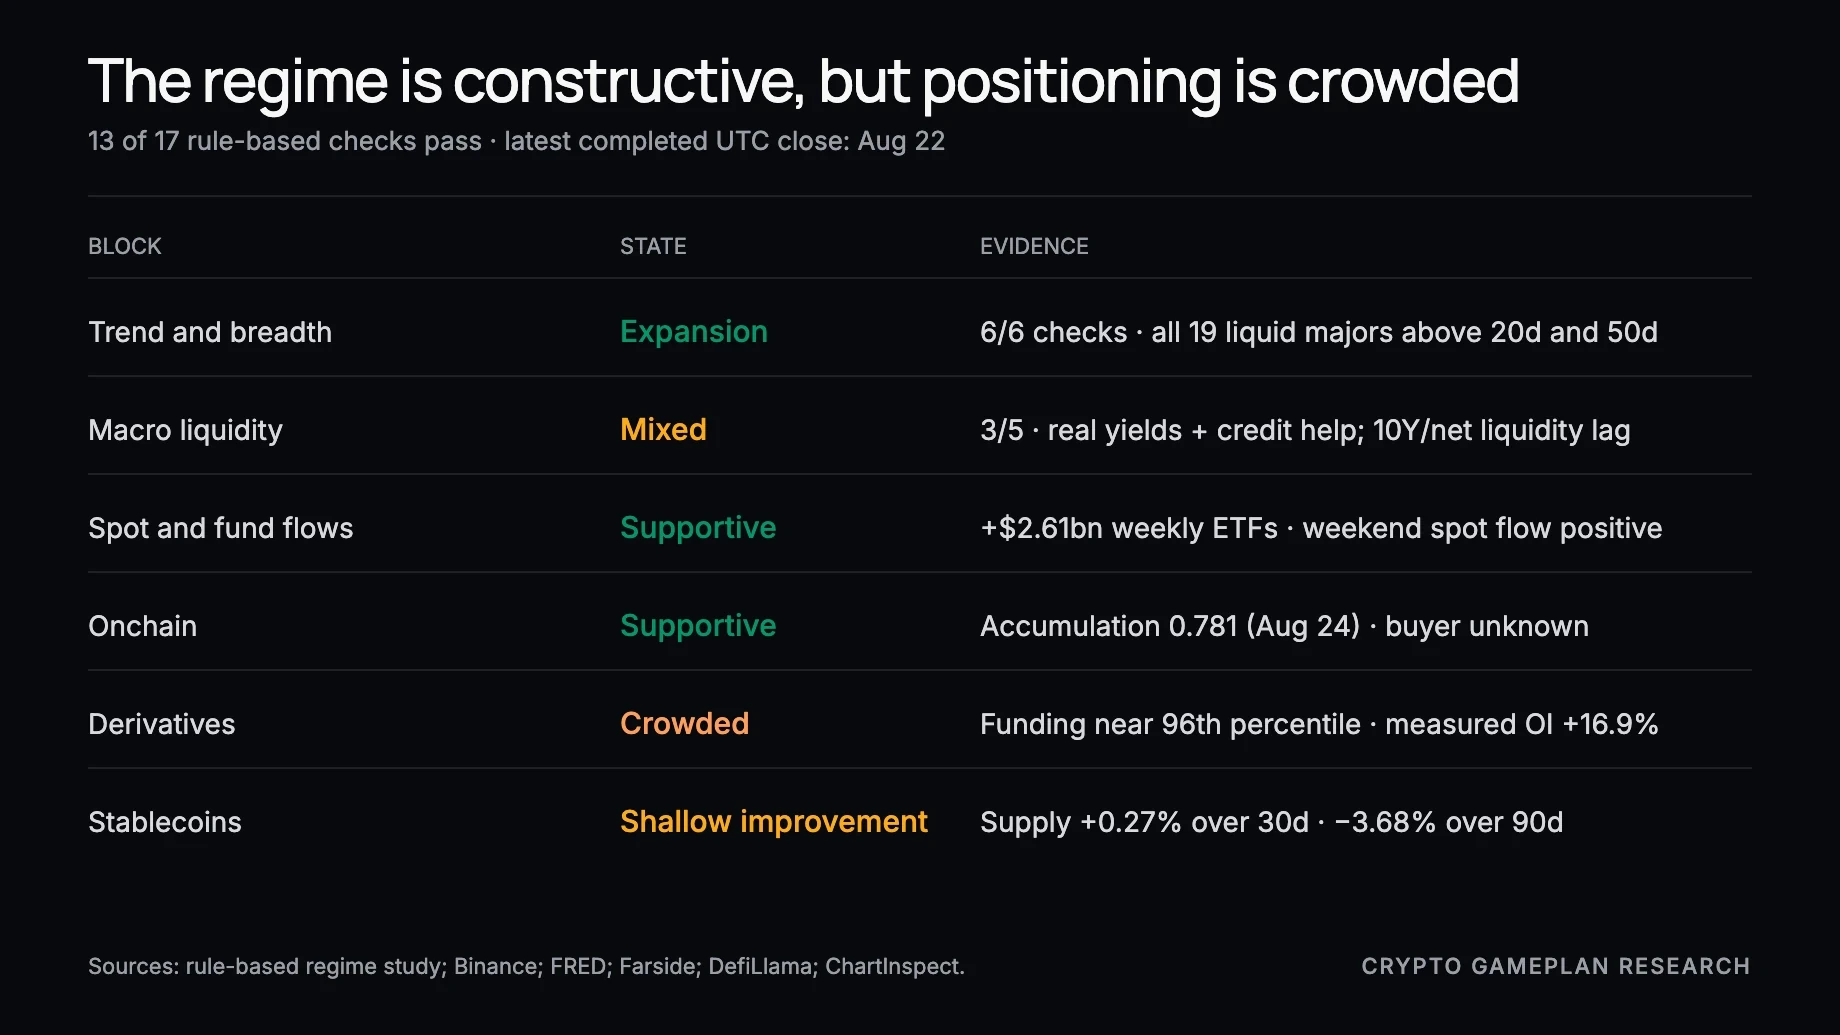
As of the August 23 research freeze, price was in an expansion regime, but the market structure was still crowded. A longer bull phase was possible. It wasn't confirmed.
Question | Evidence | Research-freeze read |
|---|---|---|
Did the news matter? | Yields and DXY fell while gold, BTC, and ETH rose within five minutes. | Best-supported first trigger. |
Was it only a short squeeze? | Daily fund creations, venue-specific spot flow, weekend retention, and Bitcoin accumulation supplied separate evidence after the forced-covering wave. | The evidence argues against a squeeze-only reading. |
Is a bull run confirmed? | No completed daily close above $79,500, and contract exposure remained elevated. | Not at the freeze. |
The first cleanup test
The August 23 pullback was constructive but incomplete: $250.57 million of long positions were liquidated, aggregate BTC open interest fell 2.65%, and BTC recovered toward $77,300. That removed some risk without confirming a completed daily close above $79,500.
The event timeline
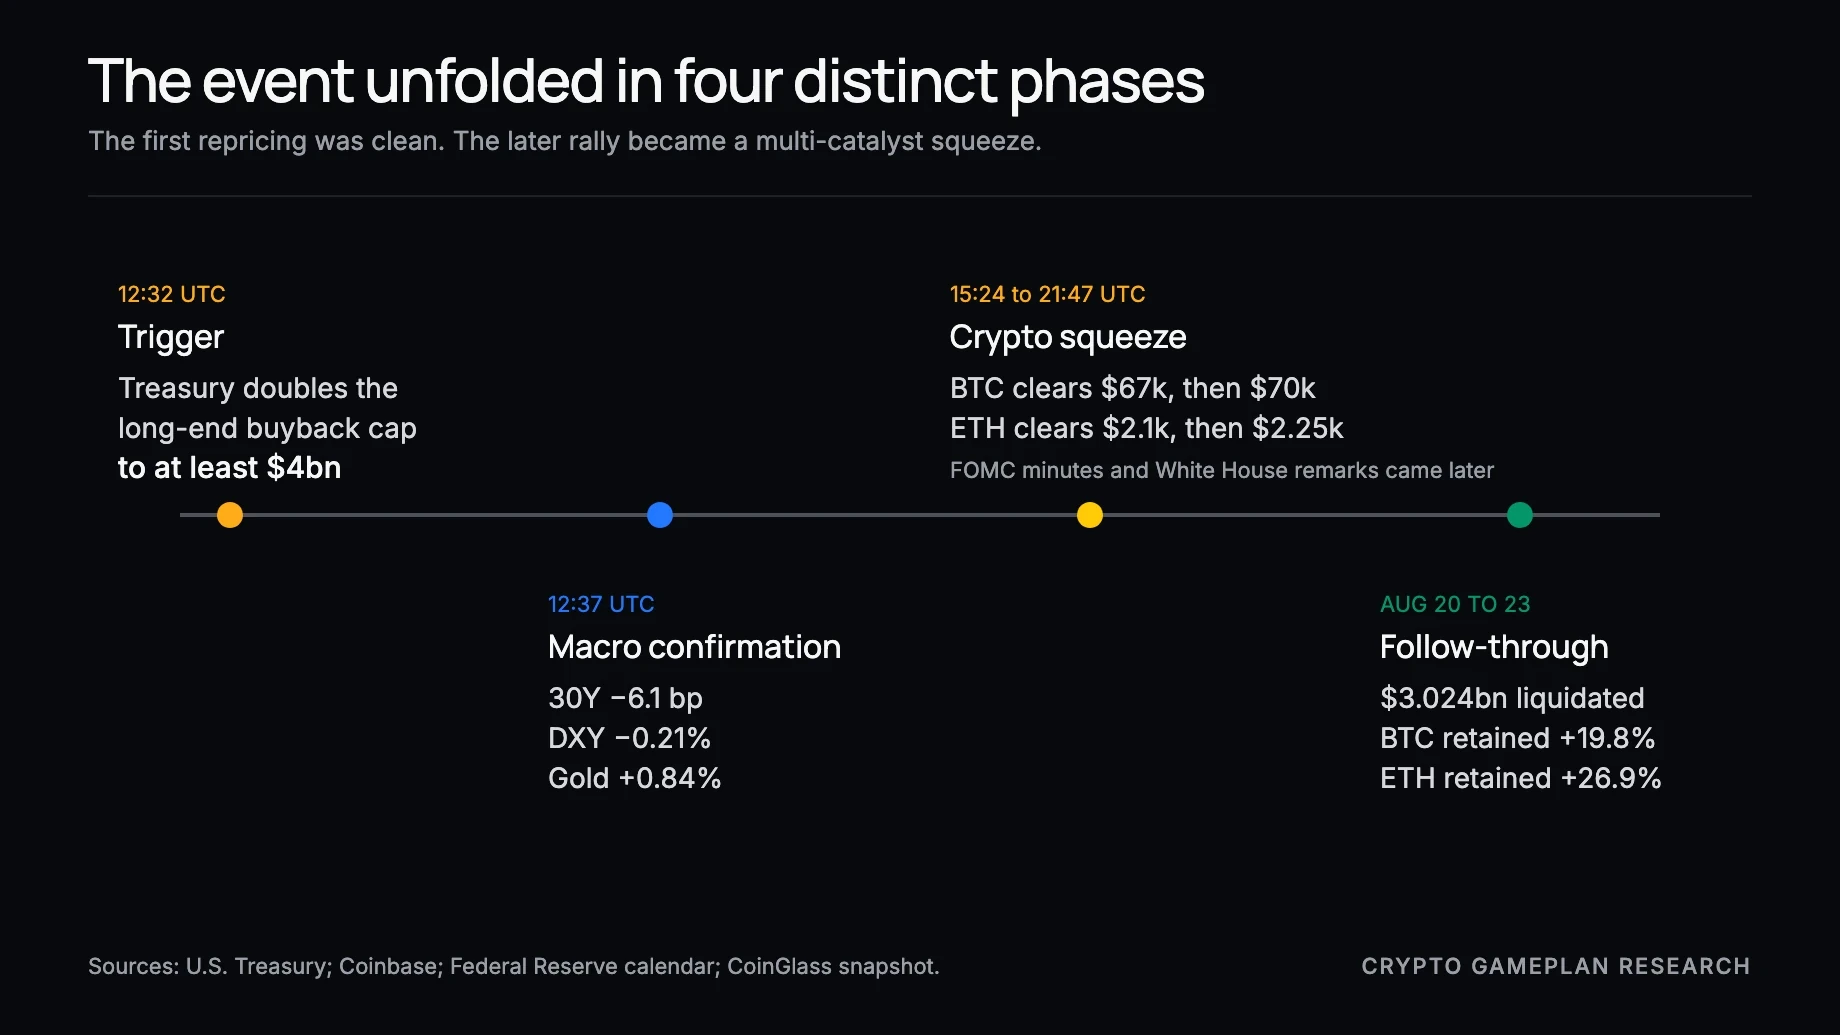
The cleanest evidence sits in the first five minutes. The later rally had several causes, so the timeline matters.
The setup before 12:32 UTC
The 30-year Treasury yield had reached 5.34% on Tuesday, its highest level since 2007. Contemporary explanations centered on war and oil risk, fiscal and inflation concern, and heavy technology-sector bond issuance. The official US calendar showed no major 08:30 release on Wednesday. That context makes the Treasury bulletin the best-supported trigger for the first joint move, without proving it caused everything that followed.
UTC | US Eastern | What happened |
|---|---|---|
12:31 | 08:31 | Pre-release baseline: BTC $64,431.50 and ETH $1,921.21. |
12:32 | 08:32 | Treasury bulletin distributed. BTC and ETH were only slightly positive in that minute. |
12:37 | 08:37 | BTC +0.31%, ETH +0.26%, DXY -0.21%, gold +0.84%, 10-year yield about 3.9 basis points lower, 30-year yield about 6.1 basis points lower. |
13:32 | 09:32 | BTC +1.04% and ETH +0.81%. |
15:24 to 15:27 | 11:24 to 11:27 | BTC broke $67,000 and ETH broke $2,100. |
18:00 | 14:00 | FOMC minutes arrived after the first crypto breaks. |
18:30 | 14:30 | White House crypto and technology remarks were scheduled. |
18:32 | 14:32 | BTC +5.93% and ETH +8.57% from the baseline. |
21:47 | 17:47 | BTC first traded at or above $70,000. |
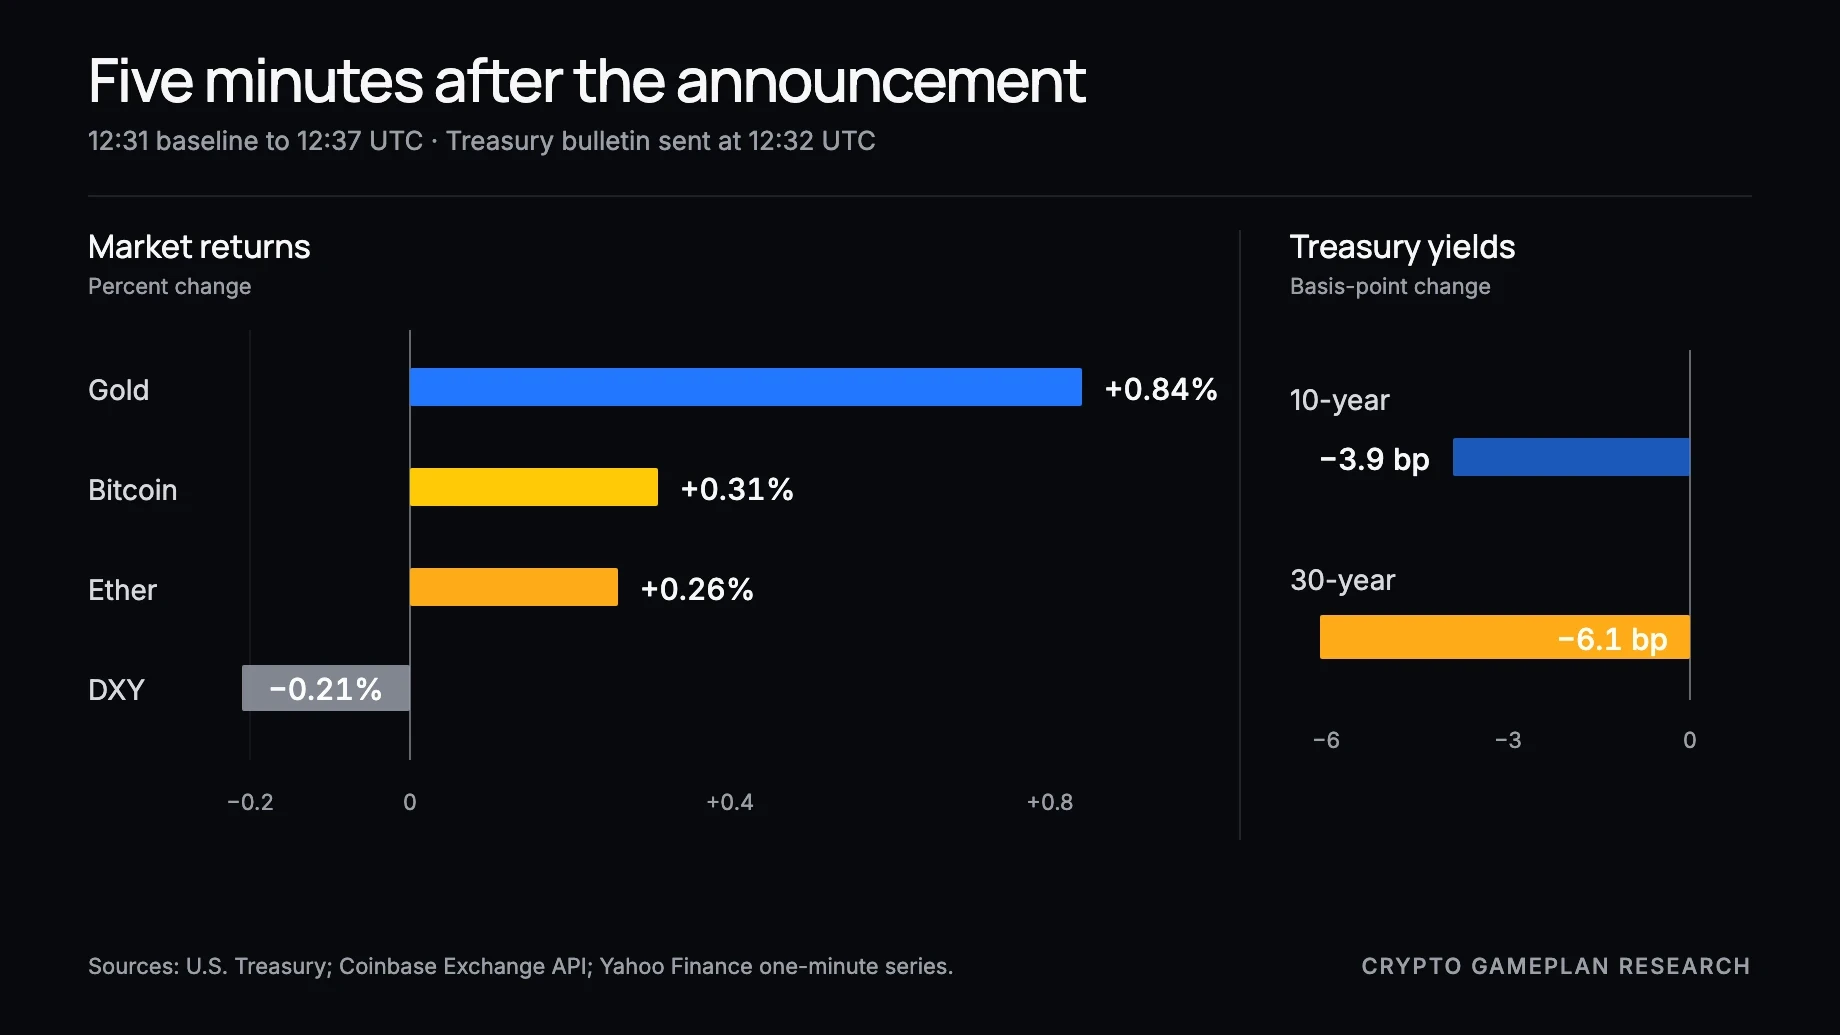
Decision rule: Treasury is the best-supported trigger for the first five-minute response. Treat the multi-hour crypto rally as a multi-catalyst, derivatives-amplified event.
Who bought, and how much contract exposure was open?
Public data can identify buyer classes. It can’t identify every end investor or reconstruct a perfect order of buyers.
1. Forced shorts were the clearest first buyer
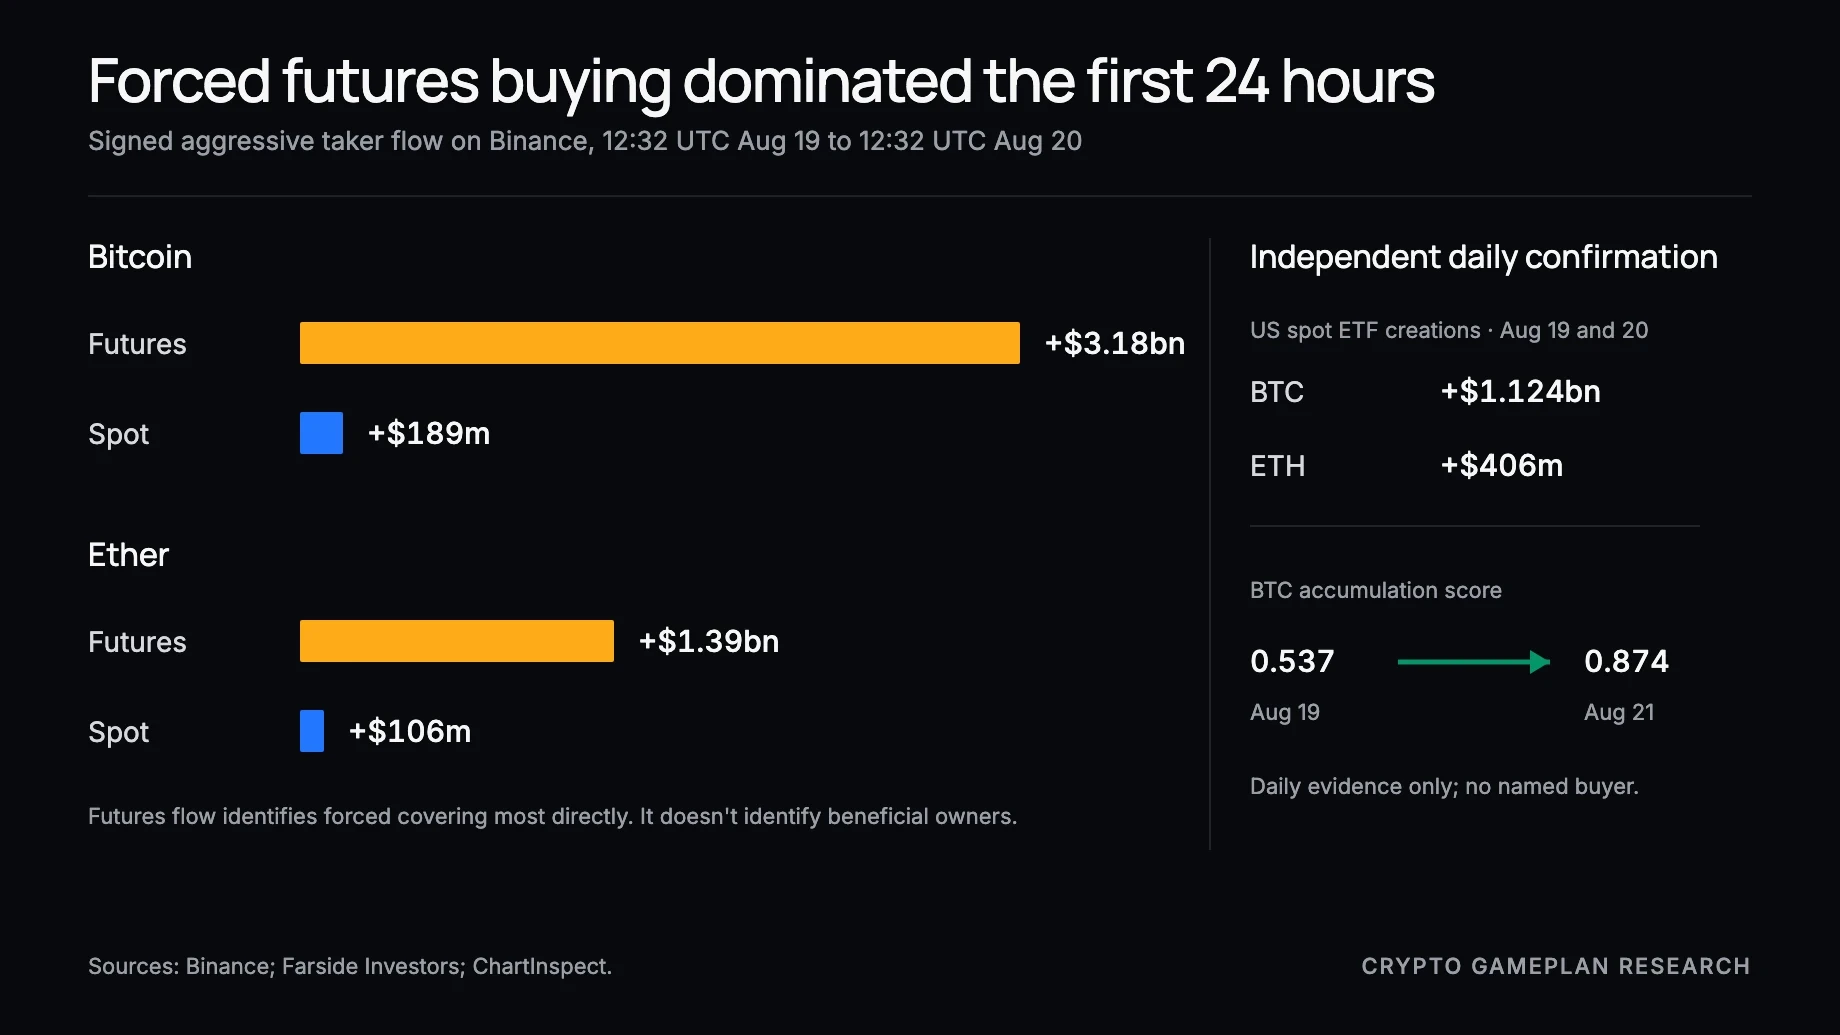
In the first 24 hours, Binance BTC futures recorded $3.18 billion more aggressive market buying than selling. BTC spot recorded $189 million. ETH futures recorded $1.39 billion, versus $106 million on spot.
Short liquidations close bearish contracts with a buy. That makes forced shorts the largest mechanically identifiable first-day buyer class.
2. Fund creations and spot flow supplied separate non-futures evidence
US spot funds recorded $1.918 billion of BTC inflows and $692.6 million of ETH inflows from August 17 through 21. Weekend Binance futures flow turned negative while spot stayed positive. These daily and venue-specific observations show that demand existed outside futures, but they don’t identify the exact intraday handoff.
3. Bitcoin addresses accumulated, but identity stayed unknown
ChartInspect’s BTC accumulation score rose from 0.537 on August 19 to 0.874 on August 21. Large-address buckets improved, but wallet reorganization and threshold crossing can mimic buying. The data support accumulation. They don’t name a whale, fund, exchange, or custodian.
The size of the derivatives system
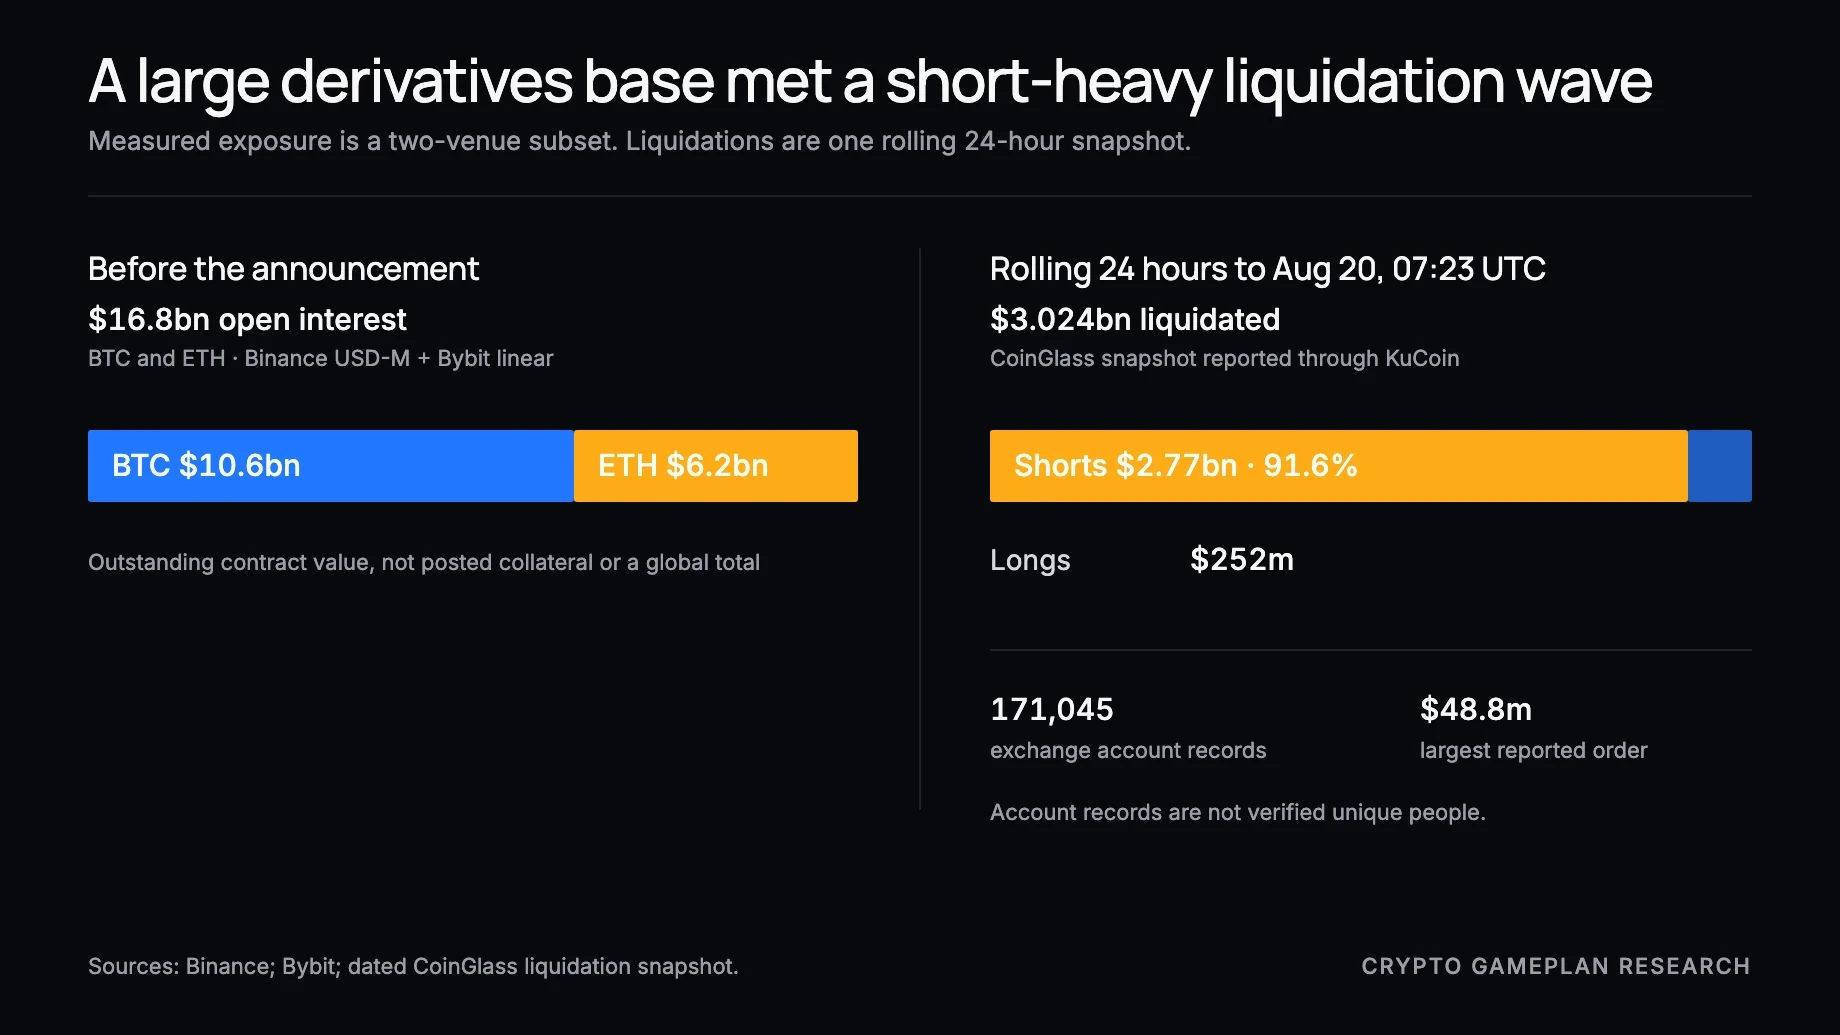
Open interest isn’t posted collateral. The same contract notional can sit on very different collateral amounts, so no public series gives one exact system-wide borrowing multiple.
What the Treasury actually changed
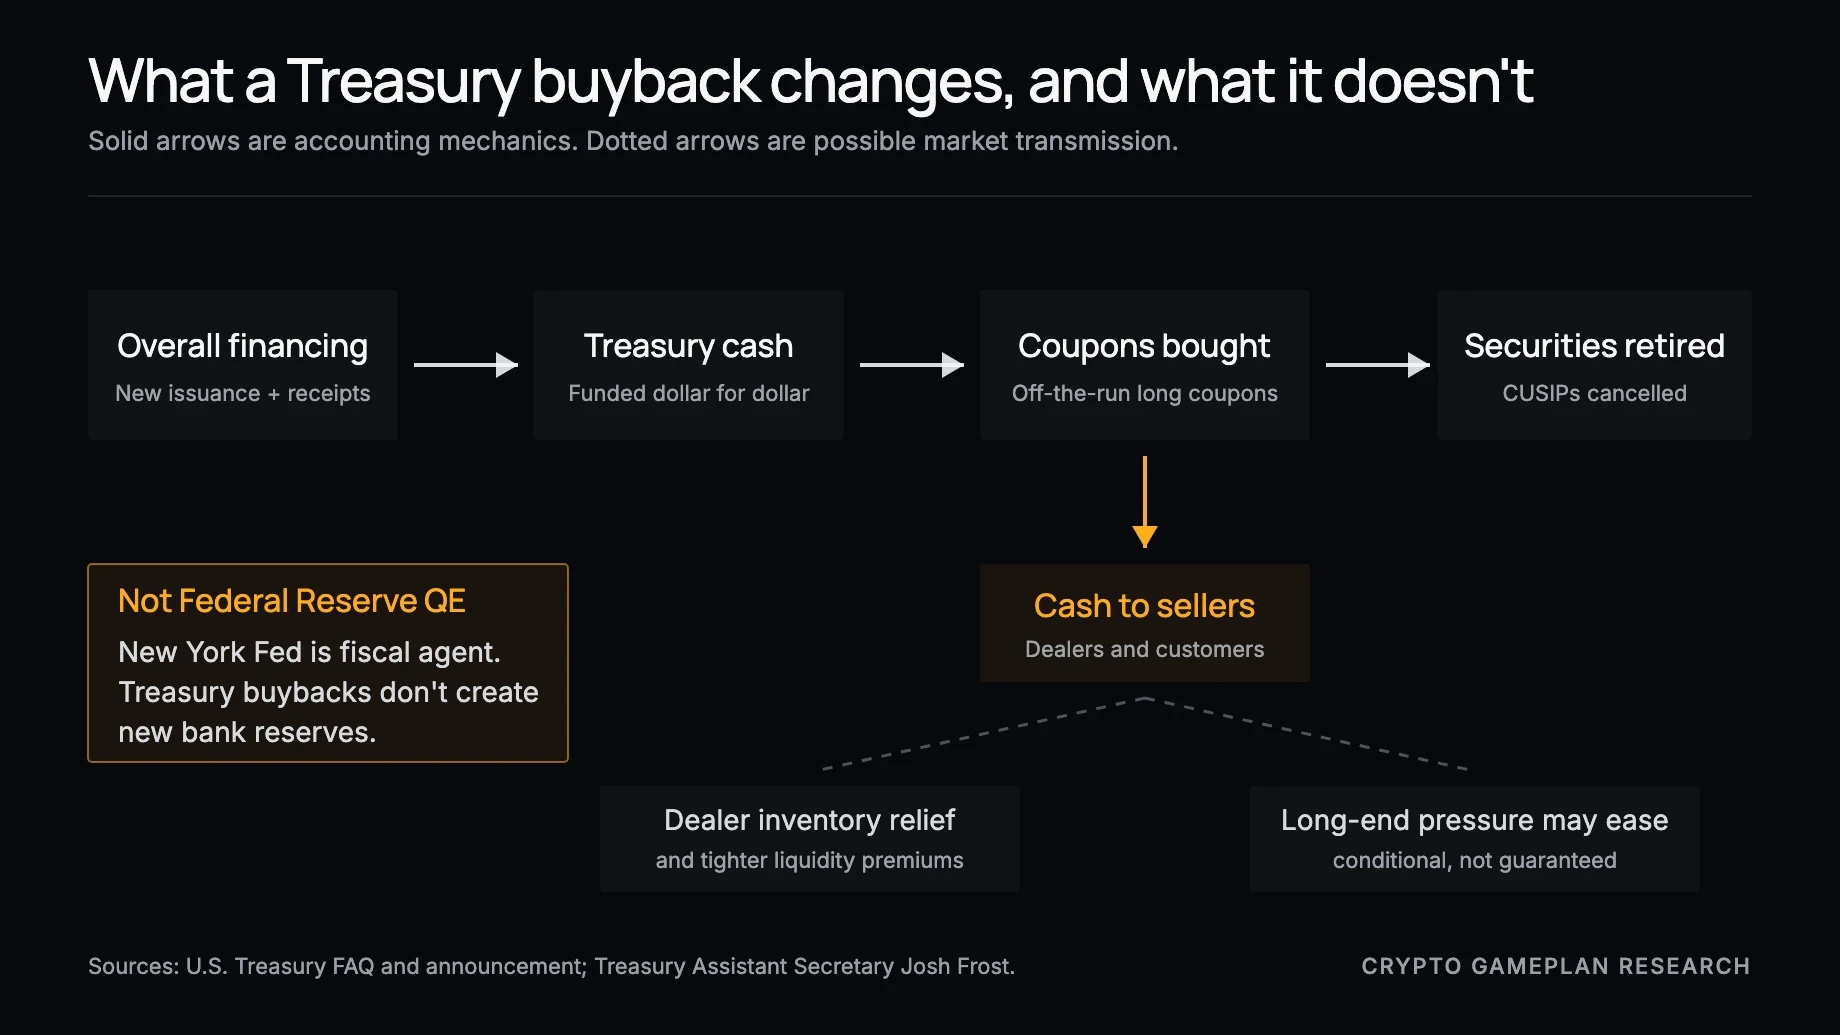
Treasury doubled the maximum size of selected long-end liquidity-support buybacks. It didn’t buy Treasury bills, create bank reserves, or inject cash on announcement day.
Documented fact | Correct interpretation |
|---|---|
10-to-20-year and 20-to-30-year nominal coupon sectors | The change targeted off-the-run long coupons. |
Cap raised from $2bn to at least $4bn per operation | The announced maximum doubled. Actual accepted amounts can be lower. |
Effective September 9 through November 4 | August 19 changed expectations. The larger operations hadn’t begun. |
The serious duration-switch thesis
Treasury can retire harder-to-trade long coupons while issuing a mix of bills, notes, and bonds elsewhere. That may improve dealer balance-sheet use, reduce off-the-run liquidity premiums, and change how much duration the private sector must hold.
The cost is refinancing risk. Shorter debt can lower current coupons when front-end rates fall, but it must be rolled more often. The state becomes more exposed to future short rates.
What would prove the stronger thesis?
Material long-coupon amounts accepted in actual buybacks.
A measurable fall in long yields, term premium, or off-the-run liquidity discounts.
Rising net bill issuance and a falling weighted average maturity.
Fed bill purchases that rise at the same time, without pretending the two programs are one transaction.
Dealer inventories and funding stress that improve after the operations.
Did the move survive the first test?
Yes, but the answer comes with a warning.
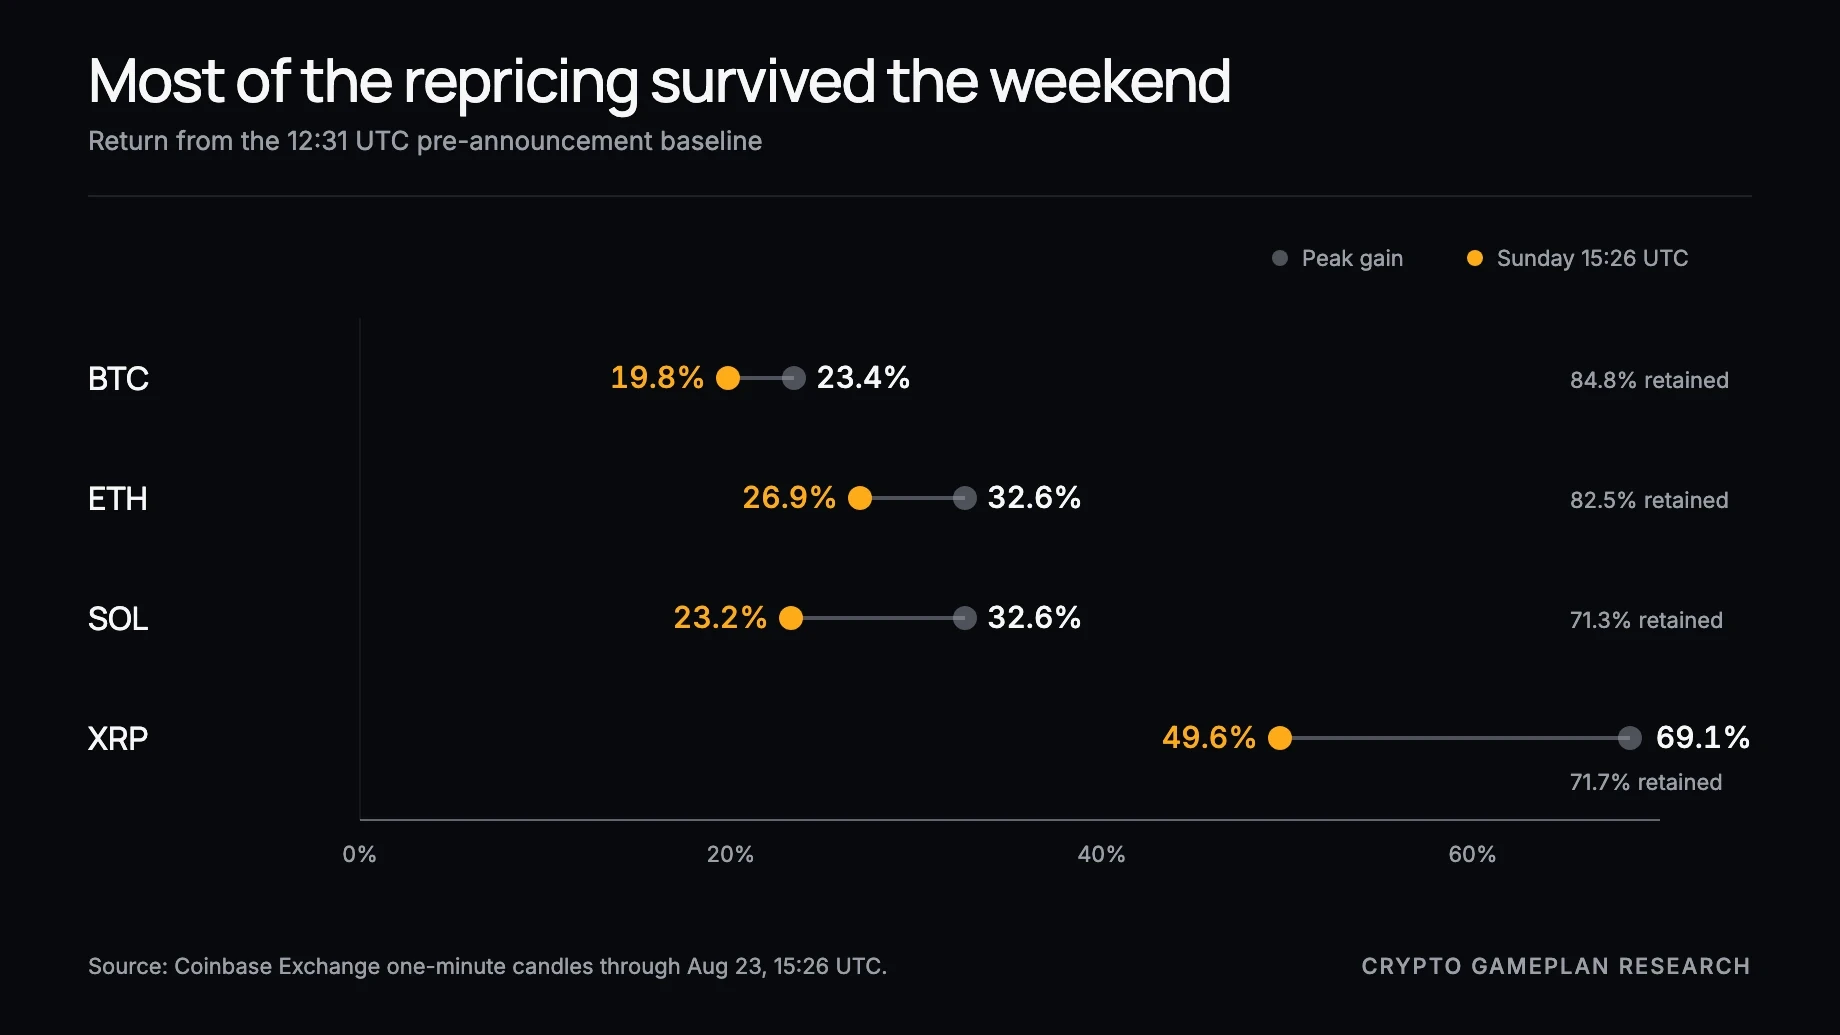
BTC and ETH retained more than 80% of their peak gains through Sunday. SOL and XRP suffered much deeper post-peak drawdowns. Worst post-peak drawdowns were -4.98% for BTC, -7.54% for ETH, -14.51% for SOL, and -21.16% for XRP.
The August 23 pullback then liquidated $250.57 million of crypto long positions in 24 hours. Aggregate BTC futures open interest fell 2.65% to $54.54 billion, funding was generally near 0.01%, and BTC recovered from about $76,088 to about $77,300.
The warning
The same two-venue BTC and ETH subset was still 16.9% above its pre-event level by Sunday. The later aggregate BTC open-interest decline only partially cleaned up the crowded structure.
That leaves a split reading: the price expansion is real, and the short-term structure remains fragile.
What history says about the bull-run claim
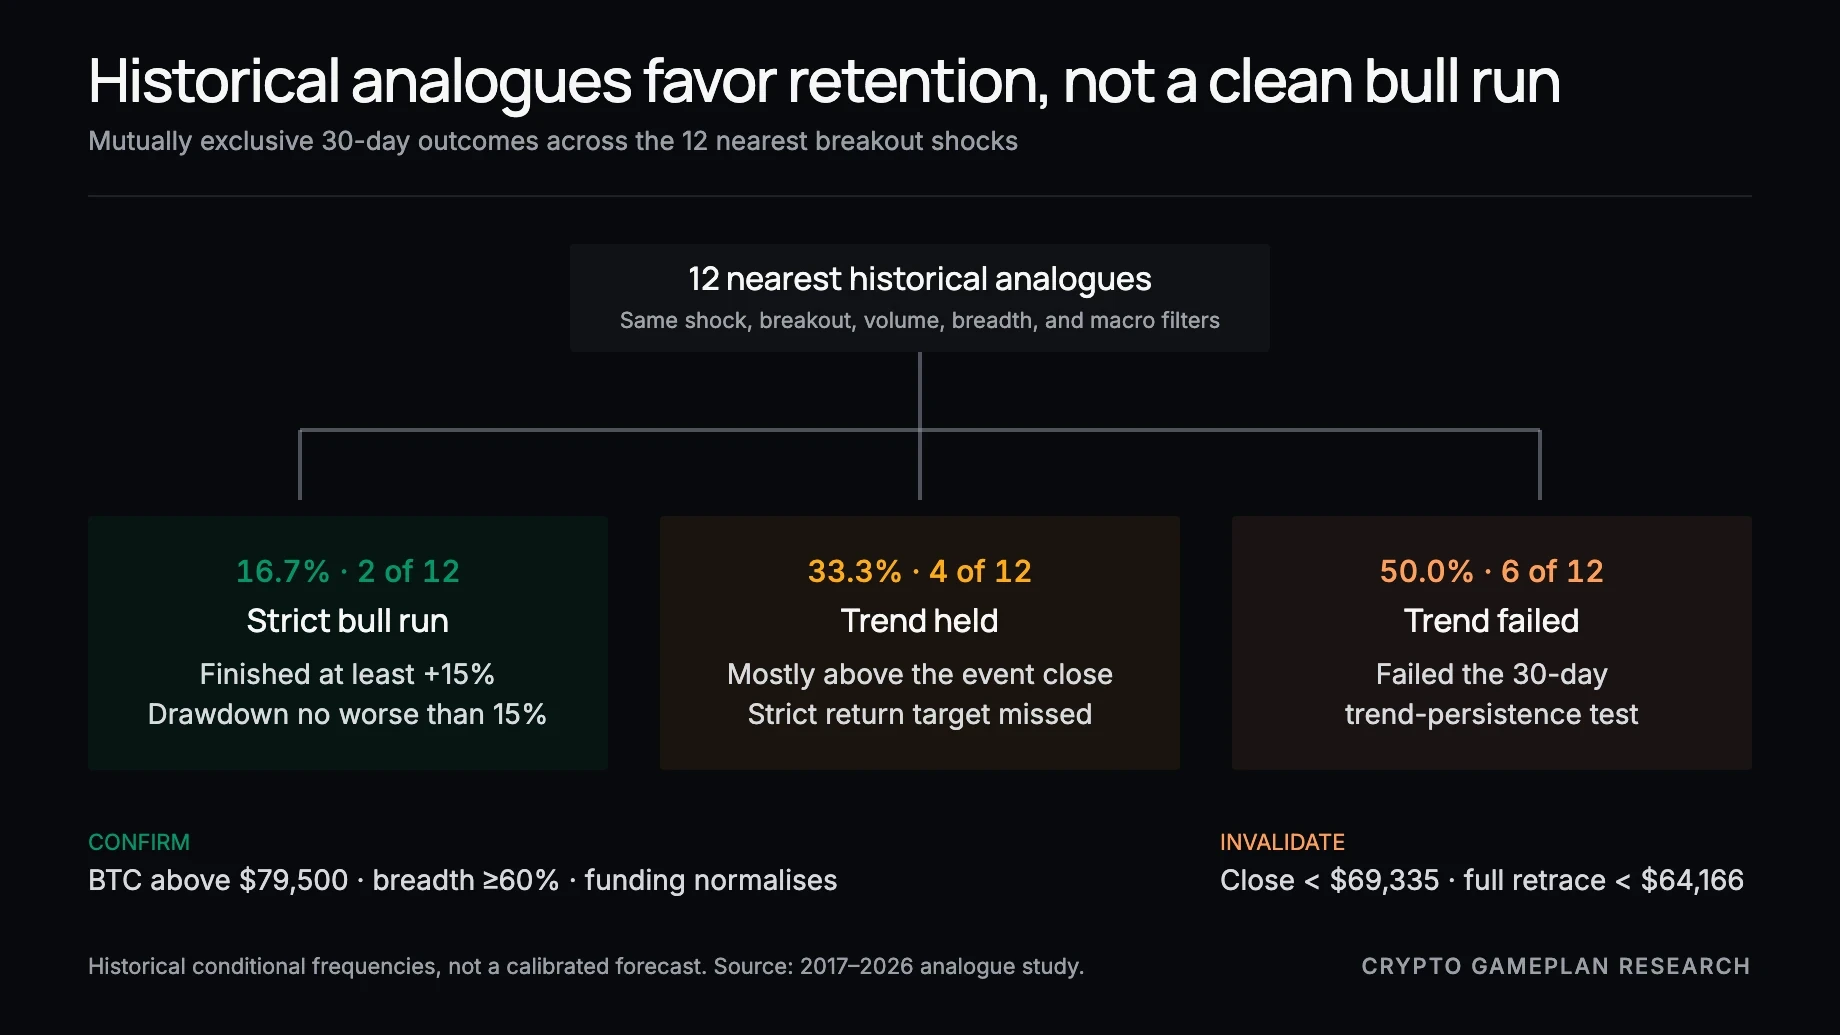
The study searched BTC history from August 2017 through August 2026 for large daily breakouts with unusual volume and a fresh 20-day high. After grouping nearby events, 28 qualified. The 12 closest matches were selected using 11 crypto and macro features.
Group | 30d strict bull | 30d trend held |
|---|---|---|
12 nearest analogues | 16.7% | 50.0% |
All 28 breakouts | 14.3% | 53.6% |
103-date comparison base | 19.4% | 24.3% |
Group | 60d strict bull | 90d strict bull |
|---|---|---|
12 nearest analogues | 16.7% | 16.7% |
All 28 breakouts | 25.0% | 25.0% |
103-date comparison base | 22.3% | 21.4% |
The stronger finding is path retention. Across all 28 breakouts, the 30-day trend-persistence rate was 53.6%, versus 24.3% in the comparison base. The adjusted p-value was 0.030.
The strict bull result wasn’t better than the base. Among the nearest 12, median returns were +3.81% at 30 days, -4.91% at 60 days, and +5.20% at 90 days. Every 90% bootstrap interval crossed zero.
Present state, not forecast
The August 23 rules passed 13 of 17 checks. A three-state model fitted to 470 weekly BTC returns assigned 78.3% to its expansion state and 21.7% to turbulence.
That 78.3% describes the state now. It isn’t the probability of a target price, and it must not be multiplied by the historical branch percentages.
Historical 30-day outcome tree
These are descriptive sample counts among the 12 nearest historical events. They aren’t calibrated probabilities or a prior for August 2026.
Exact test: The strict-bull branch required an ending return of at least +15%, no drawdown worse than -15%, at least 70% of days above the event close, a positive finish, and a close above the 200-day average. The trend-held branch passed the persistence test but missed the strict-return test; the final branch passed neither.
Five pillars update the live description
This is an author-defined monitoring rubric, not a calibrated model. Use it to keep repeated reviews consistent. It doesn’t alter the historical frequencies or forecast returns.
Pillar | Supportive | Adverse |
|---|---|---|
Price and breadth | BTC daily close above $79,500, breadth at least 60%, ETH/BTC positive. | BTC below $69,335 with breadth below 50%, or below $64,166. |
Spot and funds | Positive five-session ETF total and spot flow while futures cool. | ETF outflow cluster and negative spot flow. |
Derivatives | Funding cools below its 90th percentile while price holds. | Price, funding, stablecoin-margined OI, and futures flow rise together. |
Macro | DXY and real yields don’t reverse, credit stays stable. | At least two of DXY, real yields, and credit spreads turn sharply adverse. |
Native liquidity and Treasury | Stablecoin supply grows, BTC accumulation stays above 0.75, and actual operations show demand. | Supply contracts, accumulation fades, and operations show weak take-up or no yield response. |
Placement at the August 23 research freeze
Working description at the freeze: constructive price regime, fragile derivatives structure, no completed daily close above $79,500, and bull phase unconfirmed.
The 12-chart monitoring board
Open the tabs in order. The first block tests price and demand, the second tests positioning, and the third tests macro liquidity and Treasury execution. Use completed data before changing the market description.
Price, breadth, and spot demand
Order | Tab | Platform | Refresh |
|---|---|---|---|
1 | TradingView | Daily close | |
2 | TradingView | Daily close | |
3 | BTC ETF and ETH ETF flows | Farside | US session end |
4 | Velo | Intraday |
Derivatives and onchain positioning
Order | Tab | Platform | Refresh |
|---|---|---|---|
5 | Funding and open interest | Velo or Coinalyze | Intraday and daily |
6 | Basis, CME OI, and CME basis | Coinalyze and Velo | Daily |
7 | BTC options skew and volatility term structure | Velo | Daily |
8 | ChartInspect | Daily |
Macro liquidity and Treasury operations
Order | Tab | Platform | Refresh |
|---|---|---|---|
9 | DefiLlama | Daily | |
10 | TradingView | US close | |
11 | Fed assets − TGA − ON RRP, reserve balances, SOFR − IORB | TradingView | Daily or weekly release |
12 | Buyback announcements and results plus Fed bill-purchase schedule | TreasuryDirect and New York Fed | Each operation |
The next policy tests
August 25: 5-to-7-year liquidity-support operation. Useful for take-up and yield response, but not the enlarged long-end sector.
September 9: the new cap becomes effective. The scheduled operation that day is short-coupon cash management.
September 10: first scheduled 10-to-20-year operation after the effective date. This is the cleanest first test.
September 18: first 30-day outcome checkpoint for the historical test.
The monitoring rubric
This five-pillar rule is author-defined and uncalibrated. It keeps reviews consistent, but it doesn’t change the historical frequencies or forecast returns.
Use completed closes and released data only.
Don’t change the description because of one headline.
Record each pillar as supportive, mixed, or adverse after two daily closes or one weekly close.
Describe the structure as fragile when derivatives are adverse and no more than two other pillars are supportive.
Reserve the empirical 30-day outcome label for the September 18 checkpoint.
This resource is for education and research. It isn’t personal financial advice or a prediction of future returns.
FROM INSIGHT TO PROCESS
Research is useful. A process you can trust is better.
Crypto Gameplan helps self-directed investors connect research, market regime, selection, risk, and exits into a documented decision process, without living in front of your computer or giving up control.
Education and research. You make and execute every final decision.

© 2026 Crypto Gameplan. All Rights Reserved.